
Penguins From Above
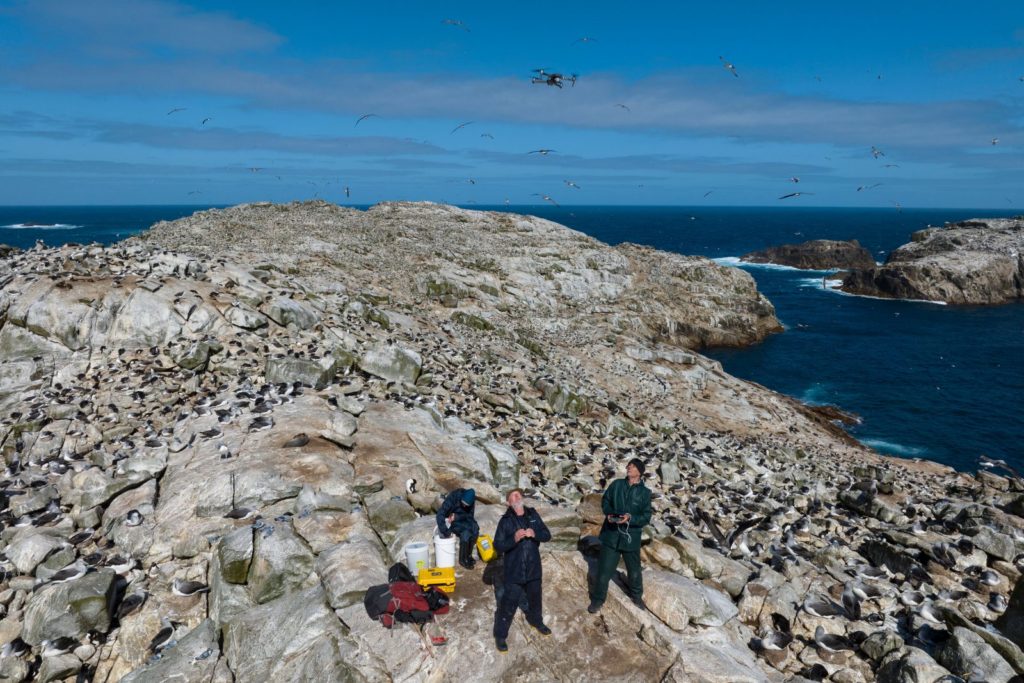
After expeditions to the subantarctic Bounty and Antipodes Islands during the past two penguin breeding seasons, we are now sitting on thousands of images taken by drones flying above penguin colonies, capturing a snapshot in time. These images allow us to count penguins on the ground and thereby obtain a reliable and, most importantly, reproducible population estimate of Erect-crested penguins.
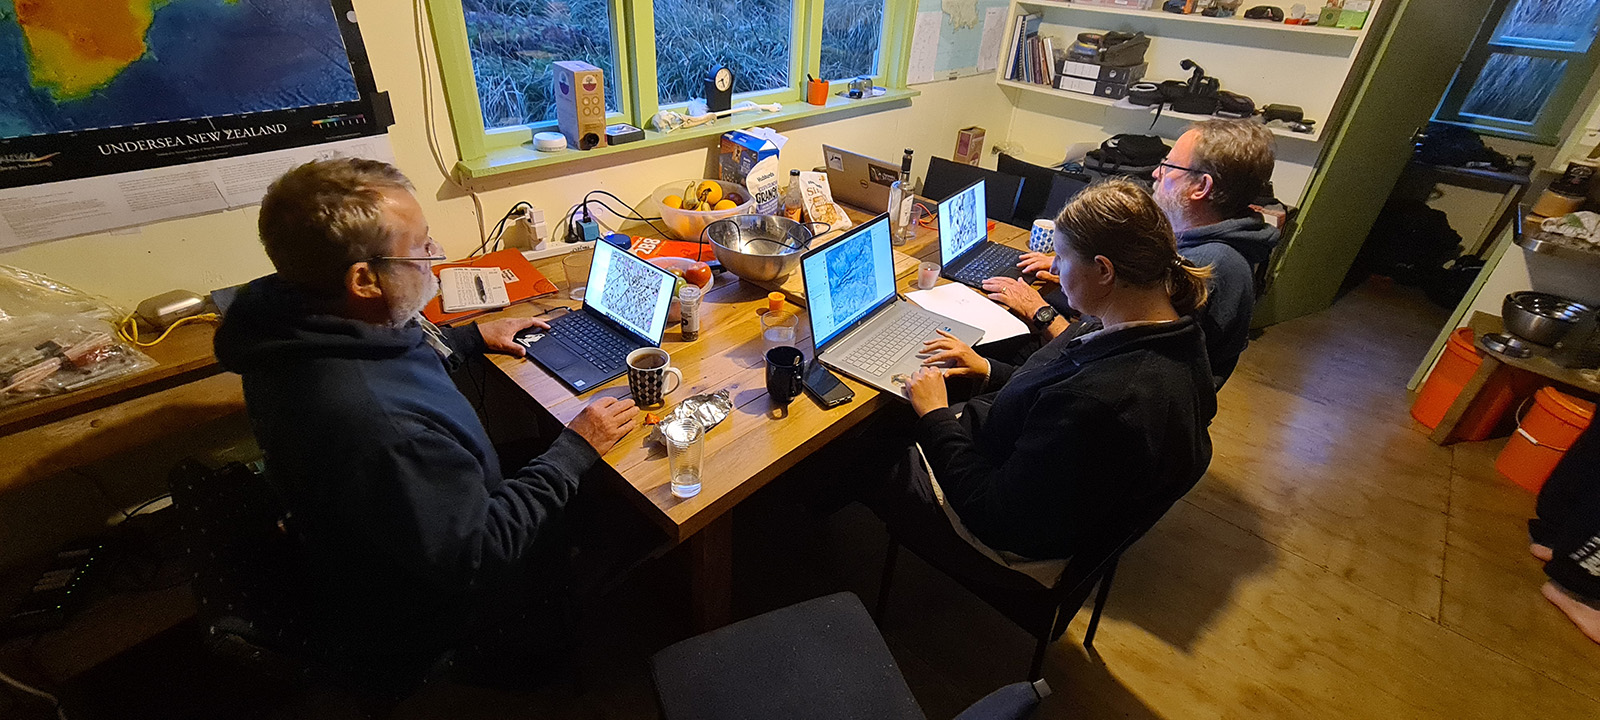
But how do we analyze these data? For the first trip in 2022, we conducted full drone surveys of both the Bounty and Antipodes Islands. It took our team more than a year to manually annotate the images of the penguin colonies photographed from above. It was a long and protracted process that kept us busy even while we were back on the Antipodes last season, recording even more survey data!
More recently, our partners at DroneDeploy added a deep learning algorithm to their web service using our data to train their AI. The model is currently in a beta state and is improving, but it needs more work.
There is also a third option—the power of the crowd. Specifically, the countless volunteers who devote some of their time to annotate images and videos on the citizen science platform Zooniverse. The platform is already familiar with penguin data as it is used by our friends from Oxford University that have been running ‘Penguin Watch‘ on the platform for a few years now. They use trail camera images, so why not do something similar with our drone footage?
We few weeks ago, we started to put together our own Zooniverse project – Penguins From Above. Last Tuesday, we were ready to have a selected group of volunteers test our project. We only uploaded data from a survey of a single colony—a total of 317 images that combined to form a massive aerial photo of the Orde Lees colony on Antipodes Island.
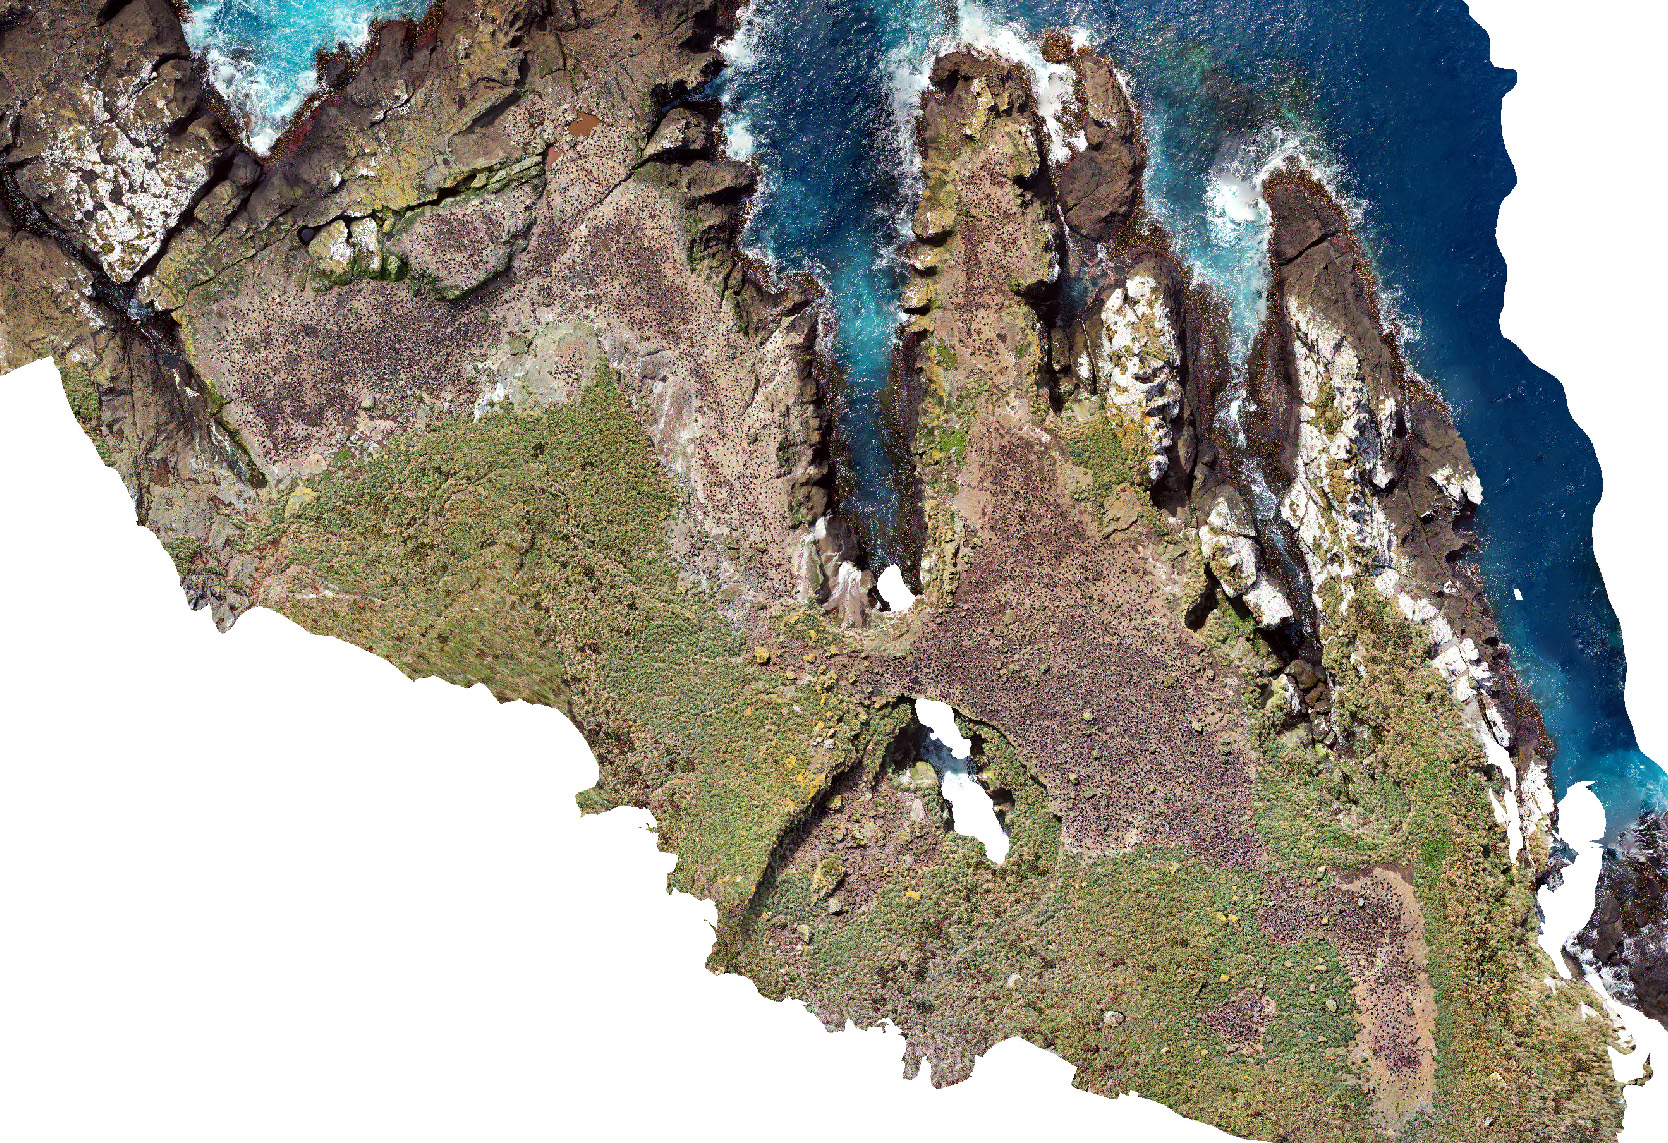
Looking at the entire image, it is impossible to make out any individual penguins. However, when you zoom in, things become clearer.
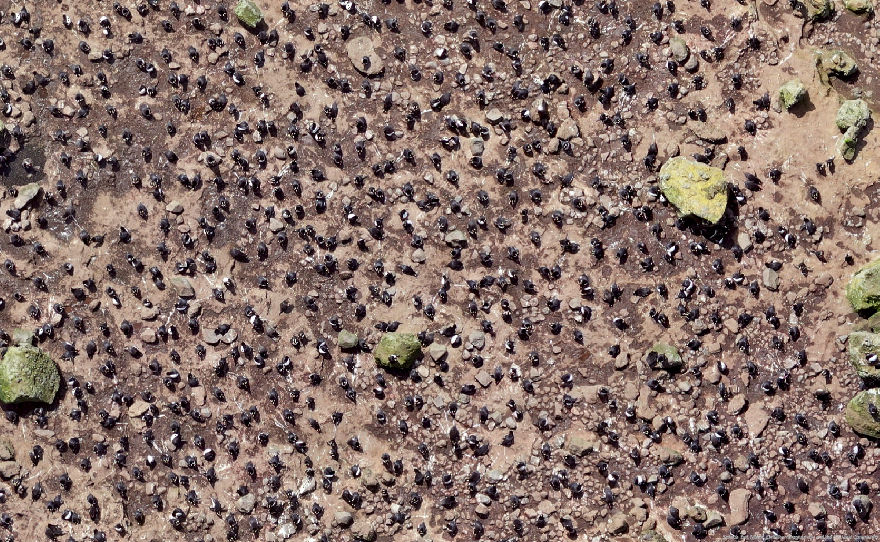
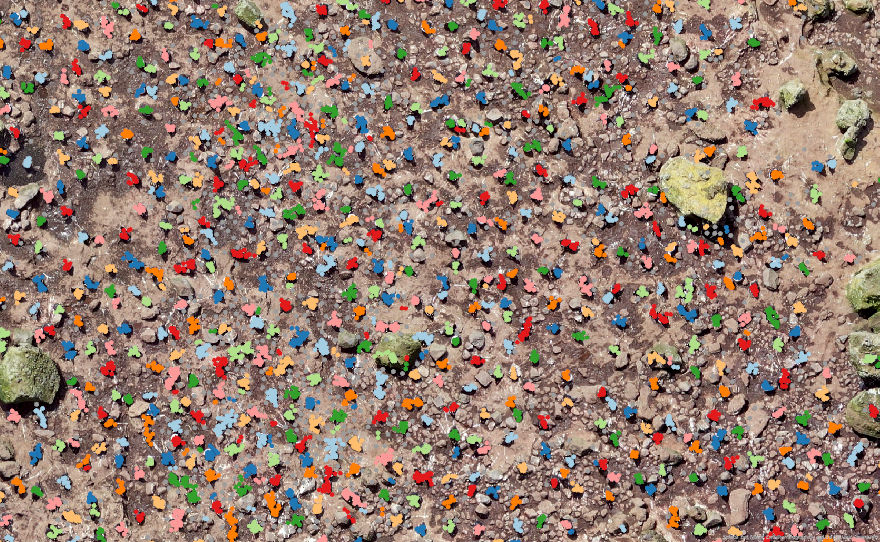
So, we chopped up the full aerial photo into 1000 x 1000 pixel chunks and uploaded them to our Zooniverse project. On Tuesday night, the beta of our project was launched. We planned to advertise the beta the next morning on our social media channels to get the results more quickly. To our astonishment, when we woke up on Wednesday morning, it was all over. In a matter of hours, 85 volunteers had placed 85,000 annotations on the images we provided.
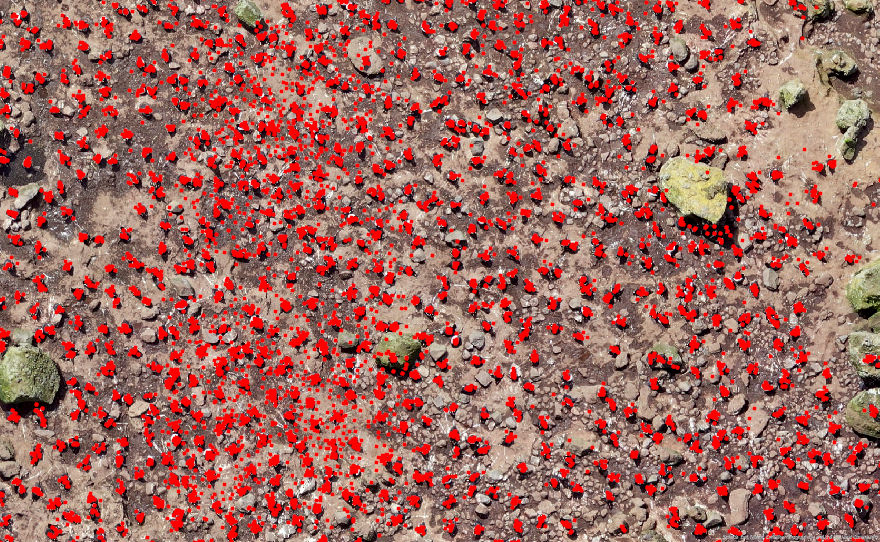
By converting the annotations to GPS positions, we ended up with a massive point cloud indicating the location of each penguin in the colony. Since each image chunk was analyzed by multiple users, we ended up with point clusters for each penguin.
Using the centroid of each point cluster, we obtained the information we were after—single points that mark each penguin in the image.
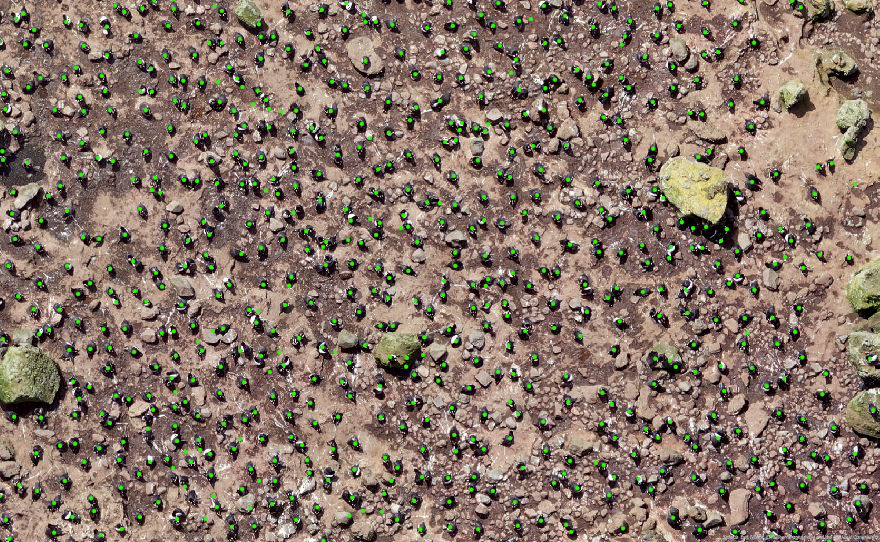
From downloading the data to having the first results took us maybe 30 minutes. The Zooniverse users counted 11,944 penguins—only 14 penguins off from our highly curated counts that took our team weeks to complete.
Clearly, the Zooniverse data needs to be groomed and validated. But we’re still excited about the possibility of using a different form of AI—‘Actual Intelligence’—for the survey data we have collected and will collect in the future. Now, we just need to get all our drone imagery ready for Zooniverse and let the amazing netizens help us count penguins.
By the way – everyone can help! Just head over to https://www.zooniverse.org/projects/tawakitom/penguins-from-above!